
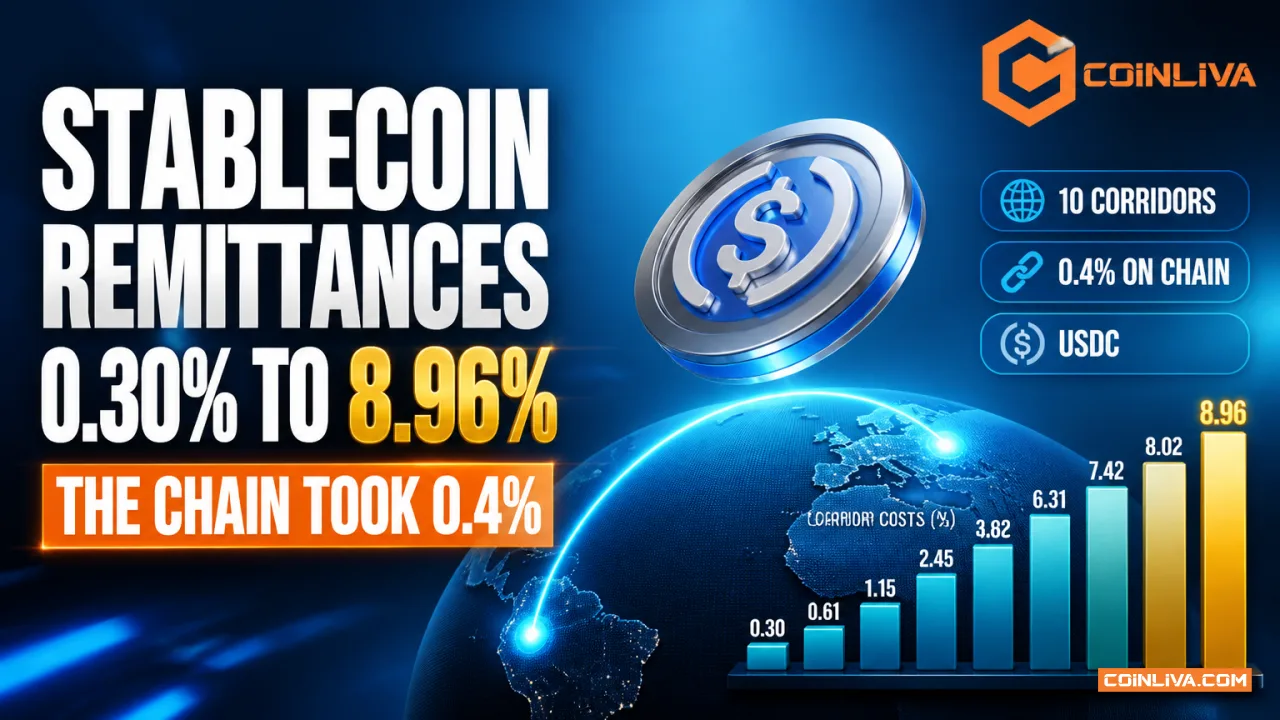
A central bank stopped arguing about stablecoin remittances and just sent the money. Banca d'Italia's payments research unit moved USDC along ten routes connecting Italy with Argentina, Brazil, Japan, South Africa and the United Arab Emirates, then added up what each trip actually cost. The cheapest leg came in at 0.30 percent, and the most expensive one, running the exact same asset over the exact same chain in the same summer, hit 8.96 percent.
That spread is the whole lesson, and it is the part almost nobody covering this study put in a headline. Most explainers of stablecoin remittances stop at the network transfer fee, which turns out to be the one number that barely matters, because the bank priced every step of the journey including the unglamorous ones sitting at either end, and those are where the money actually went. Thirty times the cost. Same token, opposite direction.
A central bank sent the money itself
The paper landed on July 31 as number 86 in the bank's Markets, Infrastructures and Payment Systems series. It is a mystery shopping exercise, which means researchers behaved like ordinary customers rather than modelling what a transfer should cost in theory. They opened accounts, funded them, bought USDC, sent it, and cashed out at the other end.
One detail in the coverage is worth flagging because it shows how quickly a figure hardens. Several outlets report the number 200 in connection with the study. crypto.news and Cryptonomist read it as the size of each transfer, 200 USDC. Cointelegraph reads it as the number of transfers executed. The corridor percentages are the part every version of the story agrees on, so those are what this piece leans on.
Volume is not the issue here. USDC alone moved many times its own supply in a single month this summer, and the market has plenty of that story already, including June's record stablecoin volume. What nobody had was a price tag on the retail journey, verified by someone with no product to sell.
Ten corridors, priced one leg at a time
Here is what the transfers cost, as reported by crypto.news from the paper.
| Route | Total cost |
|---|---|
| Italy to Argentina | 0.30% |
| Italy to Japan | 1.30% |
| Japan to Italy | 1.60% |
| Brazil to Italy | 2.21% |
| Italy to Brazil | 2.70% |
| Italy to South Africa | 4.58% |
| South Africa to Italy | 5.44% |
| UAE route one | 7.20% |
| UAE route two | 8.95% |
| Argentina to Italy | 8.96% |
Read the table twice. The point is not the average, which would be a useless number to send anyone home with. The point is that a single asset produced a thirty-fold cost range depending on which end of which corridor you happened to be standing on.
Notice how the pairs behave. Brazil and Italy priced almost symmetrically, 2.21 percent one way and 2.70 percent the other, because both countries run competitive exchange venues and instant domestic settlement. Japan and Italy also stayed close, at 1.60 and 1.30 percent. Argentina broke the pattern by a factor of thirty. South Africa leaned expensive in both directions. The UAE routes were the only pair where stablecoin remittances landed above seven percent going either way, which points at the ramps in that market rather than at any single policy.
Direction changed the price by thirty times
Italy to Argentina: 0.30 percent. Argentina to Italy: 8.96 percent. The blockchain did not know or care which direction the transaction was travelling. Bitcoin and Ethereum charge by transaction weight, not by passport.
What changed was the exit. Sending out of Italy means buying USDC on a regulated European venue, funding that purchase through an instant euro payment, and handing the recipient a token they can sell into a peso market where dollar demand is permanent and the local off-ramp is competitive. Reverse it and you are buying dollars in a country with capital controls, paying whatever spread the local venue decides a dollar is worth that morning, then cashing out into euros through a European exchange withdrawal that carries its own fee.
Two of those four steps are fiat banking. Neither of them got faster or cheaper because a stablecoin was involved.
The chain took 0.4 percent
crypto.news put the average on-chain share at 0.4 percent of the total cost. Everything else, meaning exchange purchase spreads, deposit funding methods, withdrawal fees and foreign exchange conversion, made up the rest.
This inverts how stablecoin remittances usually get sold. The pitch is that a transfer costs a fraction of a cent and settles in seconds, which is true and which describes maybe one twentieth of the actual journey. A remittance is not a transfer. It is a purchase, a transfer, a sale, and a withdrawal, and three of those four happen inside institutions that have their own pricing.
Break a single transfer into its parts and the arithmetic becomes obvious. Step one, you fund an account and buy USDC, paying a trading fee plus whatever spread the venue quotes against the dollar. Step two, the tokens move, and this is the 0.4 percent slice. Step three, the recipient sells those tokens into local currency, paying a second trading fee and a second spread that is usually wider because local dollar liquidity is thinner. Step four, they withdraw local currency to a bank account or a cash agent, paying a withdrawal fee and sometimes an implicit foreign exchange markup on top. Three of the four steps are priced by an institution with a spread sheet, and stablecoin remittances do not get to skip any of them.
The plumbing between a bank account and a token has become valuable enough that large payment companies now buy it outright, which is the context behind Mastercard's BVNK acquisition. Firms are paying for the ramps, not the rails. That tells you where the margin sits.
Where stablecoin remittances lost to Wise
The bank compared its results against Wise where the same corridor existed on both sides. USDC came out cheaper in three corridors, including Italy to Argentina, Italy to South Africa and Brazil to Italy. Wise was cheaper in the other four, both UAE routes among them.
Against the World Bank's global remittance average of 6.65 percent, stablecoins looked good in most corridors. Against an actual modern fintech competing for the same customer, they lost more often than they won. The bank noted that its live transfers and the Wise quotes were captured on different dates, which weakens the comparison, and said plainly that the findings cannot be generalised to every provider or route.
Governor Fabio Panetta had already put the position in May: stablecoins may work in selected corridors without providing a universal answer to expensive remittances. The paper reads like the evidence assembled behind that sentence.
Speed came from the local payment system
Where both countries ran instant domestic payments, the full journey finished in under twenty minutes. Italy has TIPS, Brazil has Pix, Argentina has Transferencias 3.0. Those three rails did more for settlement time than any block interval. The on-chain portion cleared in under fifteen minutes in seven of the eight comparable corridors, which was never the bottleneck.
South Africa was the counterexample. Standard bank transfers on the fiat ends stretched the journey to one or two business days, with the tokens sitting idle while a bank decided what to do.
Japan produced the strangest result. Local rules pushed the researchers into an unhosted wallet and forced them to break the transaction into pieces. The inbound leg completed at 1.60 percent. The outbound leg never finished its final off-ramp at all. Anyone who read Coinliva's earlier walkthrough of Japan's stablecoin framework will recognise why a compliant transfer there behaves nothing like a compliant transfer into Buenos Aires.
FAQ: stablecoin remittances
Are stablecoin remittances cheaper than a bank wire?
Usually, based on this data. Nine of the ten corridors came in under the World Bank's 6.65 percent global average. That average includes some genuinely expensive traditional channels, so clearing it is a low bar rather than a victory.
Why did one corridor cost almost nine percent?
Because the exit was expensive. Buying dollars inside a capital-controlled market and then withdrawing euros from a European exchange stacks two spreads and two fees on top of each other. The chain contributed almost nothing to that total.
Does using a cheaper blockchain fix this?
Barely. If the on-chain share averages 0.4 percent of the cost, moving to a chain with lower fees can only touch that slice. The other 99 percent sits with exchanges, banks and currency conversion.
Which stablecoin did the bank test?
USDC only. The paper does not tell you how USDT, a euro-denominated stablecoin, or any bank-issued token would have performed on the same routes.
Do stablecoin remittances settle faster than a bank?
Where both ends run an instant domestic payment system, yes, and by a wide margin: under twenty minutes end to end. Where one end still relies on standard bank transfers, the tokens arrive in minutes and then wait a day or two for a human process to release the cash. The chain is rarely the slow part.
How should someone price a corridor before sending?
Price all four steps rather than one. Get the purchase spread on the sending venue, the network fee, the sale price on the receiving venue, and the withdrawal or cash-out fee, then compare that total against a quote from a conventional provider on the same day. A quote taken a week apart is not a comparison.
Nothing about the underlying technology changes here. The chain performed exactly as advertised: fast, cheap, indifferent to direction. The cost lived in the two places where a stablecoin touches a bank, and no amount of throughput improvement reaches those places.
For anyone building in this space, the study is a map of where the work is. Argentina at 0.30 percent shows what a corridor looks like when both ends have competitive ramps and an instant domestic payment system. The UAE routes at above seven percent show what happens when they do not. The Bank of Italy's own framing, that stablecoin rails and domestic instant payment systems worked as complements, is the practical read.
The next question is whether anyone repeats this exercise with a different token, a different set of corridors, or the same corridors six months from now. Until someone does, ten routes priced by one central bank in one summer is the best public evidence available on what stablecoin remittances actually cost.